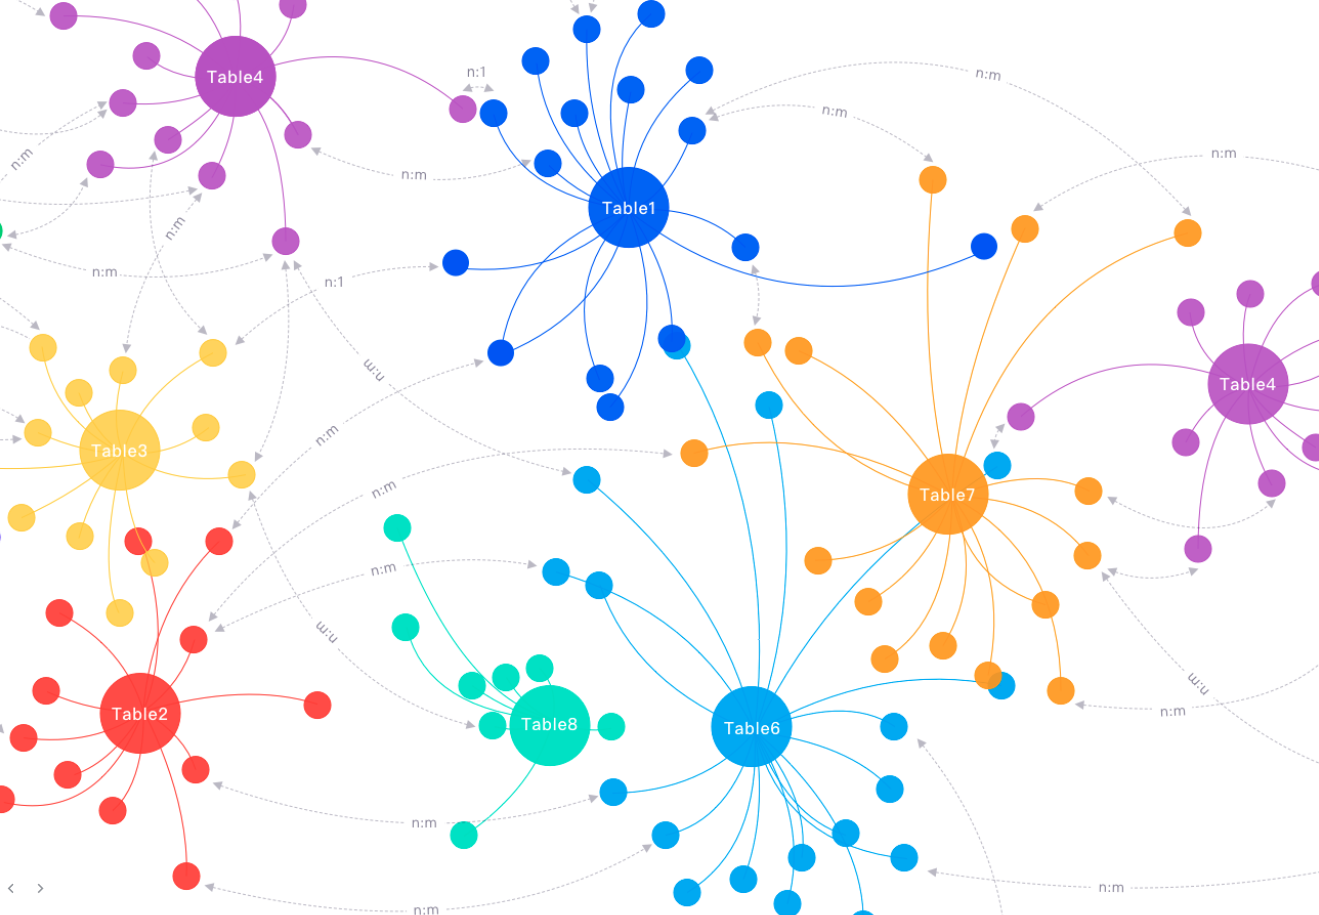
啊、需求你如此丰富,促使我进步。
总之又搞起antv了。
先看需求图

没时间记录分析过程,直接上代码:
获取二次贝塞尔曲线控制点
  function getPoint(sx, sy, ex, ey) {
    // 获取开始,结束点所在直线1公式
    const k = (ey - sy) / (ex - sx);
    const b = (k * (sy + ey) + (sx + ex)) / (2 * k);
    // 以开始点为旋转中心,逆时针旋转30度,获得该直线2公式
    const angle = Math.atan2(ey - sy, ex - sx) / (Math.PI / 180) + 30;
    const k1 = Math.tan((Math.PI * angle) / 180);
    const b1 = sy - k1 * sx;
    // 中间控制点即为直线1和2的交点
    const c1x = (b - b1) / (k1 + 1 / k);
    const c1y = k1 * c1x + b1;
    // 以数组形式返回中间控制点坐标
    return [c1x, c1y];
  }
第一种方式在quadratic上拓展
            G6.registerEdge(
              'line-arrow',
              {
                labelPosition: 'center',
                labelAutoRotate: true,
                getShapeStyle: function getShapeStyle(cfg) {
                  const { startPoint } = cfg;
                  const { endPoint } = cfg;

                  const b = getPoint(startPoint.x, startPoint.y, endPoint.x, endPoint.y);

                  const style = G6.Util.mix(
                    {},
                    G6.Global.defaultEdge.style,
                    {
                      stroke: 'rgba(194, 192, 203, 1)',
                      lineWidth: 1,
                      lineDash: [2, 2, 2],
                      path: [
                        ['M', startPoint.x, startPoint.y],
                        ['Q', b[0], b[1], endPoint.x, endPoint.y],
                      ],
                      startArrow: {
                        path: 'M 0,0 L -6,-3 L -6,3 Z',
                      },
                      endArrow: {
                        path: 'M 0,0 L -6,-3 L -6,3 Z',
                      },
                    },
                    cfg.style
                  );
                  return style;
                },
              },
              'quadratic'
            );
第二种方式,直接自己定义边
            G6.registerEdge(
              'line-arrow',
                 draw: function draw(cfg, group) {
                   const { startPoint, endPoint } = cfg;

                   const b = getPoint(startPoint.x, startPoint.y, endPoint.x, endPoint.y);

                   const shape = group.addShape('path', {
                     attrs: {
                       path: [
                         ['M', startPoint.x, startPoint.y],
                         ['Q', b[0], b[1], endPoint.x, endPoint.y],
                       ],
                       stroke: 'rgba(194, 192, 203, 1)',
                       lineWidth: 1,
                       lineDash: [2, 2, 2],
                       startArrow: {
                         path: 'M 0,0 L -6,-3 L -6,3 Z',
                         fill: '#333',
                         stroke: '#666',
                       },
                       endArrow: {
                         path: 'M 0,0 L -6,-3 L -6,3 Z',
                         fill: '#333',
                         stroke: '#666',
                       },
                     },
                   });
                   const a = [(startPoint.x + endPoint.x) / 2, (startPoint.y + endPoint.y) / 2];
                   group.addShape('text', {
                     attrs: {
                       text: cfg.label,
                       fill: 'rgba(194, 192, 203, 1)',
                       x: (a[0] + b[0]) / 2,
                       y: (a[1] + b[1]) / 2,
                     },
                   });
                   return shape;
                 },
              },
            );
graphin完整代码:
示例data:
{
    nodes: [
      {
        id: 'node-0',
        label: 'node-node-0',
        data: { id: 'node-0', label: 'node-0', properties: [] },
        shape: 'CircleNode',
        size: 78,
        style: { nodeSize: 24 },
      },
      {
        id: 'node-1',
        label: 'node-node-1',
        data: { id: 'node-1', label: 'node-1', properties: [] },
        shape: 'CircleNode',
        size: 26,
        style: { nodeSize: 24 },
      },
    ],
    edges: [
      {
        shape: 'line-arrow',
        source: 'node-0',
        target: 'node-1',
        label: 'edge-0_1',
        labelCfg: {
          autoRotate: true,
          style: {
            stroke: 'white',
            lineWidth: 5,
            fill: 'rgba(194, 192, 203, 1)',
          },
        },
        data: {
          shape: 'line-arrow',
          source: 'node-0',
          target: 'node-1',
          label: 'edge-0_1',
          properties: [],
        },
      },
    ]
}
      <Graphin
        style={{ width: '100%' }}
        ref={graphRef}
        data={{ nodes, edges }}
        register={{
          edgeShape: (G6) => {
            G6.registerEdge(
              'line-arrow',
              {
                labelPosition: 'center',
                labelAutoRotate: true,
                getShapeStyle: function getShapeStyle(cfg) {
                  const { startPoint } = cfg;
                  const { endPoint } = cfg;

                  const b = getPoint(startPoint.x, startPoint.y, endPoint.x, endPoint.y);

                  const style = G6.Util.mix(
                    {},
                    G6.Global.defaultEdge.style,
                    {
                      stroke: 'rgba(194, 192, 203, 1)',
                      lineWidth: 1,
                      lineDash: [2, 2, 2],
                      path: [
                        ['M', startPoint.x, startPoint.y],
                        ['Q', b[0], b[1], endPoint.x, endPoint.y],
                      ],
                      startArrow: {
                        fill: 'rgba(194, 192, 203, 1)',
                        path: 'M 0,0 L -6,-3 L -6,3 Z',
                        lineDash: [0, 0, 0],
                      },
                      endArrow: {
                        fill: 'rgba(194, 192, 203, 1)',
                        path: 'M 0,0 L -6,-3 L -6,3 Z',
                        lineDash: [0, 0, 0],
                      },
                    },
                    cfg.style
                  );
                  return style;
                },
              },
              'quadratic'
            );
            return [
              {
                name: 'test',
                register: () => {},
              },
            ];
          },
        }}
        layout={{
          name: 'force',
          options: { animation: true, enableWorker: true, damping: 0.5, repulsion: 160 * 5 },
        }}
        options={setting}
      />